

Emerging Market Digest: June 2025

Read the publication below or click here to open the PDF.
In our previous edition of the Emerging Markets Digest, we discussed how the outcome of the US presidential elections could disrupt global trade and the economic outlook for emerging markets (EMs). Since then, we have gone from post-electoral euphoria on financial markets to bouts of extremely volatility. Longstanding geopolitical and geo-economic relationships are being re-examined (and re-shaped) and former safe havens, like US treasuries and the US dollar, are increasingly put into question. Spill-over effects to emerging markets are already clearly visible, particularly in forex markets.
Weaker EM growth outlooks
2025 has been tumultuous so far for emerging markets. Most EMs started the year on a favourable footing, but extremely high levels of uncertainty, especially around US trade policy, are increasingly weighing on their growth outlooks.
It was widely expected that president Trump would increase tariffs on goods imports during his second presidency but both the broad scope as well as the levels of the announced Liberation Day tariffs nonetheless came as a surprise. How large the direct impact of tariffs will be for individual EMs depends on the tariff rates, their longevity, the size of potential retaliatory measures (from tariffs to outright export bans) and the importance and composition of exports to the US (see figure 1). The degree to which EM exports can be redirected to other countries and the availability of alternatives for US consumers (either domestic or from other countries) will also play an important role.

Currently, all reciprocal tariffs that came on top of the 10% global base tariff and the pre-Liberation day tariffs have been paused temporarily and several carve-outs have been announced. This has eased some of the immediate pressures on global trade but the overall uncertainty around US trade policy remains very high. Whether these reciprocal tariffs will be reinstated after the pause and at what level is extremely hard to predict. Aside from country-specific tariffs, there is also the looming risk of additional product- or sector-specific tariffs. President Trump has already threatened to end the pharmaceuticals tariff exemption, and he ordered a probe into potential new tariffs on all US critical minerals imports. The latter would affect several EMs, including China, Mexico, South Korea, Brazil, and South Africa.
While the direct impact of higher US trade tariffs will likely be moderate in most major EMs outside of Asia and Mexico, spillover effects from growth slowdowns in the US, other advanced economies and China could be more significant. There is also an indirect negative growth effect coming from delayed investments as investors await more clarity on trade developments before making new investment decisions.
Clouded inflation outlook
During the post-covid recovery period and energy crisis, many EM central banks were quick to tighten monetary policy aggressively as global inflationary pressures built up. But while inflation rates came down substantially in most EMs in 2023, many have since stabilized at still relatively elevated levels (see figure 2).

In the last couple of months, uncertainty has started to blur the inflation outlook, with the expected slowdown in global GDP growth weighing on commodity and energy prices. We also expect US dollar weakness, brought on by (trade) policy uncertainty, ballooning fiscal debt, weakened confidence about enduring US exceptionalism and expected monetary policy easing by the fed, will add additional downward pressure on inflation in most EMs by lowering import prices. However, the risk of a protracted period of above target inflation is very real in many of these economies.
China
China has taken an outspoken combative stance in the trade dispute with the US. The first two tariff increases of 10% on goods imports from China, which president Trump justified by pointing to China’s alleged role in the US fentanyl-crisis, were met with relatively mild countermeasures. Those included inquiries into US firms, targeted tariffs on specific goods and export bans on critical materials. Come ‘Liberation Day’, the US issued tariffs on all countries in the world but singled out China by increasing its already elevated tariffs by a staggering total of 54%. This triggered a genuine escalation of the trade war, with China now putting blanket tariffs on all US goods imports and following US tariff increases in lockstep. After reaching a 125% blanket tariffs on US goods imports, China communicated that it would not react to any further tariff increases by the US as it considered that with a 125% tariff “there is no longer a market for U.S. goods imported into China”. In addition to raising import tariff rates, China also hit back by suspending the export of several critical rare earth elements, metals and magnets while the government is drafting a new regulatory system for exports. This suspension came on top of earlier export restrictions on rare earth elements.
Another important trade order of president Trump that came into effect at the beginning of May was the removal of the so-called “de minimis’ exemption. This ends the long-standing duty-free access for low-value (<800 USD) shipments from China and Hong Kong to the US. Trump had briefly halted this loophole in February, but had to pause the cancellation after millions of packages started to pile up at customs as it proved challenging for customs officials, delivery companies and retailers to process these packages under the new rules.
On 12 May, the US and China reached an agreement to pause the additional tariffs for 90 days. This brought the retaliatory tariffs on both sides back to the base rate of 10%, to which the 20% fentanyl-linked rate that was introduced before Liberation Day and other existing tariffs need to be added for Chinese imports into the US. The White House also decided to cut the "de minimis" tariff on China shipments with a value below 800 USD to 54% from 120% and to forgo the planned increase of the flat rate from 100 USD to 200 USD.
The pause in the trade war is probably just a first and temporary step in the eventual de-escalation of the trade conflict. A full-blown trade deal still needs to be hammered out and negotiations are expected to be tense. Unless new fiscal and monetary stimulus measures are announced and implemented, the damage done by the tariffs and general uncertainty surrounding trade policy will likely make it difficult for China to reach its 5% real GDP growth target for 2025.
At the end of 2024, the Chinese government pledged “more proactive” fiscal measures and “moderately” looser monetary policy to boost domestic consumption in 2025. So far, the government’s efforts to support growth are still deemed relatively modest. Fiscal support has been centered around extending the trade-in-program for durable consumer goods and the equipment renewal plan. Monetary policy actions and communications point to a still measured and reactive easing approach, which is attributed to concerns about the health of the banking system and more generally to financial stability risks.
The stronger- and sooner-than-expected reduction of US-China trade tariffs has fueled concerns that the motivation for the Chinese government to support the economy may have waned and that less stimulus measures and structural reforms can be expected as a result. This while the trade conflict with the US again emphasised the need for China to reduce its dependency on investments and exports. Making domestic demand the main engine of growth has long been a goal of the government but efforts to reconfigure growth have so far been too limited and progress has been supressed by the crisis in the credit-fuelled real estate sector.
Based on the sizeable escalation of the US-China trade war and the (lower but) still elevated US tariffs on Chinese goods imports, the expected global economic slowdown and the relatively limited size of government support measures at the moment, we forecast a modest 4.2% real GDP growth in 2025 and 4.1% in 2026. On the inflation front, we expect price pressures coming from tariffs will likely be more than compensated by the slowdown in domestic and global growth. For 2025, we forecast CPI will be 0.0% in 2025 and 1.2% in 2026. The outlook for the Chinese economy will depend strongly on how trade relations with the US progress after the 90 day tariff pause and how the Chinese government responds to these changes.
India
India is better positioned than many other emerging markets to deal with US tariffs and global trade disruptions thanks to its robust internal growth drivers, its sizable domestic economy, and its low(er) dependence on goods trade. Government initiatives to boost private consumption, expand the country’s manufacturing capacity, and increase infrastructure spending will also help offset the weaker growth outlook. As a result, India is poised to remain the fastest growing major economy over the next two years. We expect real GDP growth in India to reach 6.2% year-on-year in 2025 and 6.3% in 2026.
The recent escalation in military tensions between India and Pakistan constitutes a (limited) risk to India’s growth and inflation outlook. The current ceasefire remains fragile and military hostilities between both countries are likely to flare up again. We do not expect major disruptions to India’s economic activity though, as the country has only minimal economic relations with Pakistan and we do not expect major international sanctions.
One upside risk to India’s growth outlook comes from its position as a viable alternative to China for US buyers, particularly in sectors like defense and telecom. India has long been a go-to-economy for companies seeking to diversity their supply chains. As such, the country could benefit from a resurgence in trade tensions between China and the US.
CEE
Recent macroeconomic indicators and economic policy measures again confirm that there are large variation in the economic landscape in the CEE region (read more in the CEE section of the KBC Economic Perspectives).
The Czech Republic exhibits steady, albeit moderate, growth with controlled inflation and low unemployment. We expect to see growth in the Czech Republic this year driven primarily by growth in real incomes and household consumption. Czech industry will be hit by the US tariffs through weaker US demand and through the negative impact of uncertainty on investment at home and abroad. Given these considerations, we estimate real GDP growth will only reach 1.7% year-on-year in 2025 and 1.5% in 2026. Inflation in the Czech Republic appears to be well-managed. We predict a continuation of the gradually decreasing path of Czech annual average HICP inflation in 2025 to 2.4% and in 2026 to 2.2%. After halving its policy rate from 7% to 3.5% between the late 2023 and now, the Czech National Bank (CNB) has indicated that it will proceed "very cautiously" at future monetary policy meetings. We see two more 25 basis point rate cuts going forward, one in the autumn of 2025 and one in 2026, but this forecast is very dependent on future developments in the US-EU trade conflict.
Hungary faces a period of stagnating GDP growth combined with persistent, though declining, inflation and a contracting industrial sector. Hungary's economy relies heavily on the automotive and electronics manufacturing sectors, making it vulnerable to shifts in global demand within these industries in general and to implications of potentially escalating trade wars in particular. In response to the emergence of external factors with potentially adverse impact on the Hungarian aggregate economic performance, we cut our forecast for Hungarian annual real GDP growth to 1.0% in 2025 and 3.5% in 2026. The expected trend of weakening inflation in Hungary remains weak, reflecting persistent inflationary pressures present in the country. Our forecast of Hungarian annual average HICP inflation is 4.5% for 2025 and 4.0% for 2026. The Hungarian National Bank (MNB) has maintained its base interest rate at 6.5% in recent months. Due to the poor economic performance in recent months and because of the expected easing of monetary policies by the ECB and especially by the Fed later this year, we expect that the MNB will cut the base rate two times during the second half of 2025. In our view, the base rate could drop to 6.0% by the end of 2025 and to 5.0% by the end of 2026.
Having exhibited a moderate real growth rate in the fourth quarter of 2024, the Slovak growth momentum appears to have softened in the early months of 2025. Looking ahead, only limited growth can be expected in 2025, potentially reflecting anticipated impact of fiscal consolidation measures. Slovakia's economy is significantly influenced by its automotive industry, making it sensitive to fluctuations in the global automotive market and (like most regional competitors) severely exposed to negative implications of the pending trade war. In anticipation of the headwinds that the Slovak economy will likely be facing going forward, we put our annual real GDP growth forecasts for the country at 1.5% for 2025 and 1.9% for 2026. We anticipate a rise in inflation in 2025 for Slovakia, primarily driven by the planned phasing out of energy subsidies and tax increases. This expected surge in inflation poses a significant challenge for Slovak households and policymakers. As for 2025, our forecast of annual average HICP inflation stands at 4.0%, while for 2026we predict a price growth deceleration to 3.1%.
Bulgaria has been performing well, with strong GDP growth figures and moderating inflation. The latter is an important condition for euro adoption. The country’s success in meeting the Maastricht criteria is expected to be confirmed in the ad hoc Convergence Reports on Bulgaria’s euro readiness (to be published on 4 June). According to the Bulgarian Ministry of Finance, it is very likely that Bulgaria will be able to adopt the euro on 1 January 2026. Given the strong performance of Bulgaria in recent months and the prospect of euro adoption, we expect real GDP growth to be 2.4% in 2025 and 2.6% in 2026. Our forecast for annual average HICP inflation in Bulgaria currently stands at 2.6% for 2025 and at 2.5% for 2026.
Latin America
The Latin American EM economies are net exporters of commodities, which makes them exposed to a slowdown in global economic activity, but different trade mixes and country-specific political and fiscal conditions translate into diverging economic outlooks.
The country with the highest trade exposure to the US is Mexico, with more than 80% of total Mexican goods exports go to its neighbours up north. Incidentally, it is also the country that was given the highest additional US import tariff in the region (25%). The impact of which is, however, dampened because goods that are USMCA-compliant (United States-Mexico-Canada Agreement) are exempt. The government’s “Plan Mexico” to boost its domestic industry could provide some support to GDP growth by amping up public investment but developments in the trade relation with the US will likely outweigh any public spending programme. As a result, real GDP growth is expected to become negative in 2025 at -0.3% and to recover only moderately in 2026 to 1.4%.
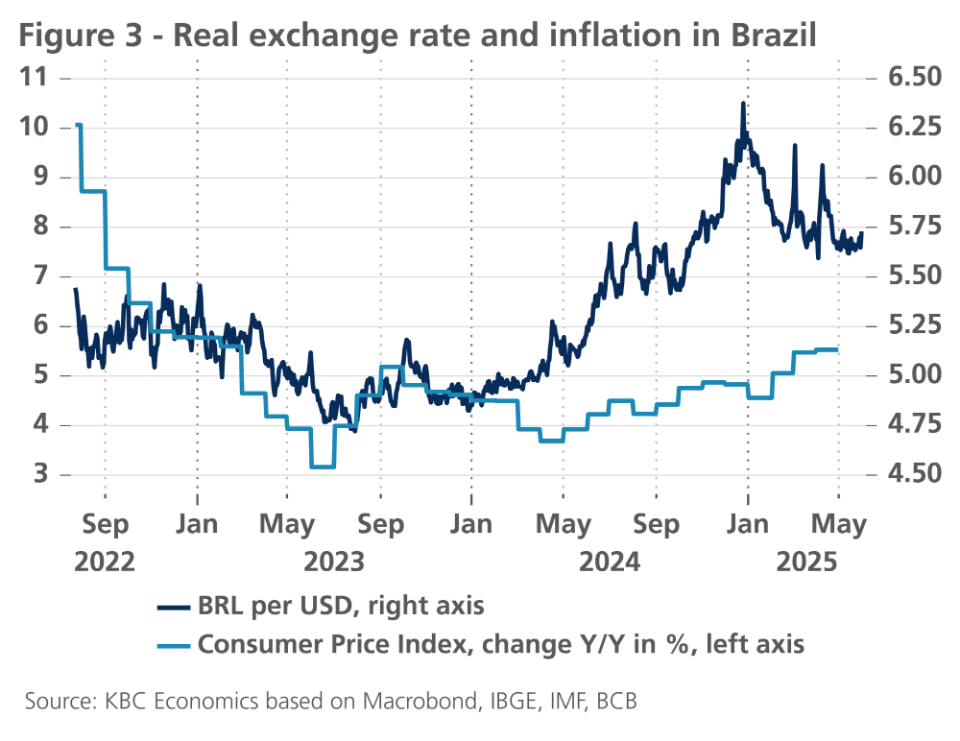
In Brazil, a stark depreciation of the currency and accelerating inflation prompted the central bank to raise its policy rate from 10.4% to 14.7% between August 2024 and May 2025 (see figure 3). The tighter financial conditions will, together with lower real wage growth, lower transfers and a tougher external environment, dampen domestic demand, which was the growth stronghold in 2024. Additional downward pressures will come from Brazil’s strict fiscal framework that was introduced in 2023. The new framework combines a primary budget target (from -0.5% of GDP in 2023 to 1.0% of GDP in 2026, growing in 0.5 percentage point increments per year and with a tolerance range between +0.25% and -0.25%) with a limit on real expansion in public spending and will force the government to rein in spending and increase revenues in 2025. On the positive side, the agricultural sector is expected to support growth in 2025 on the back of record harvests of soybeans and cotton after adverse weather conditions negatively affected crop production last year. Brazilian real GDP growth is expected to hover around 2% this year and next.
In Argentina, the economic situation has changed drastically since President Milei took the reins in December 2023. Sweeping austerity measures have turned the fiscal deficit into a small surplus for the first time in more than a decade and inflation has dropped from almost 300% (year-on-year) in April 2024 to below 50% in April 2025 (see figure 4).

Milei also managed to secure a 20 billion USD loan from the IMF, this allowed Argentina to lift many of its capital and currency controls. Against expectations, this has not resulted in a major devaluation of the Argentine peso. It is, however, too soon to celebrate as the currency is supported by carry trades and some short-term measures, like a temporary tax break on commodities exports to encourage the quick sale of agricultural products. Many believe the currency is still overvalued given weak fundamentals, including the country’s large debt burden. Meanwhile, staying on the austerity path has become me more difficult of late as the October mid-term elections draw closer while protests against the government are intensifying and president Miliei approval ratings is declining.
After an austerity-driven 1.7% contraction in 2024, the economy is set to grow by 5.5% in 2025 on the back of a rebound in consumption and rising investment. In 2026, economic growth is set to moderate to 4.5%. Inflation will continue its downward path and average 35.9% in 2025 and 14.5% in 2026. Despite recent improvements, there are still sizeable downward risks to the economic outlook. These include high poverty rates, reform fatigue, the dependence on IMF financing, and vulnerabilities related to public debt and the exchange rate.
For all Latin American EMs, progress in the Mercosur trade deal between the block and the EU is a reason for cautious optimism. The deal was sealed last year but still needs to be approved by the EU member states. If ratified, the trade agreement would create one of the biggest free trade zones in the world. The deal still faces hurdles, especially due to opposition from France and Poland, but increased trade tensions between the US and the rest of the world are softening some of the most critical voices.
South Africa
South Africa is faced with strong headwinds, both domestically and internationally. On the international front, the relationship between South Africa and the US has soured dramatically since president Trump started his second term, resulting in the withdrawal of vast amounts of US financial aid to South Africa. Together with many other African countries, South Africa was hit by a high reciprocal tariff by president Trump before the 90-day pause. This not only raised concerns about economic developments in the region but also dampened hopes of a renewal of the African Growth and Opportunity Act (AGOA), an agreement that gives duty-free access to the US market to eligible countries in Sub-Sahara Africa for a large array of products, which it is set to expire in September 2025. The 25% tariff on all automotive imports into the US is currently hurting the South African automotive sector, which was a large beneficiary of the AGOA in the past. A potential return of the 31% reciprocal tariff would further cloud the overall growth outlook for South Africa, as will a global growth slowdown primarily due to reduced export demand and lower investment flows.
The external risks and difficulties are further amplified by domestic political problems. In a historic first, the National Budget that was presented to Parliament had to be withdrawn due to controversy over a proposed VAT increase. The third version of the budget, which no longer includes a VAT hike, will likely to be approved soon. Still, the stalemate has exposed rifts between the coalition partners, which will likely weigh on consumer and business confidence going forward.
The recent issues add to structural problems that South Africa faces, which include stubbornly low growth and persistently high unemployment, widespread corruption, a bloated public sector wage bill, chronic poverty and inequality and unreliable essential services such as electricity, water, transport and vital infrastructure.
The combination of internal and external headwinds and the lack of structural reforms are likely to continue holding back economic growth going forward. We expect real GDP growth to be 1.6% in 2025 and 1.9% in 2026. Inflation is expected to be 4.1% in 2025, with upward pressure coming from a 5.5% increase in public servant salaries and an upward electricity price adjustment. As the inflation forecast is below the target midpoint of 4.5%, we expect the central bank will keep its policy rate unchanged at 7.5% in the coming months. Another 25 basis point rate cut to the neutral rate by the end of the year is possible but the central bank has emphasized that future moves will be highly outlook dependent, responsive to data developments, and sensitive to the balance of risks to the forecast.
TABLES AND FIGURES


Outlook emerging market economies NOTE:
Forecasts are those prevailing on 12 May 2025
| Real GDP growth (period average, in %) | Inflation (period average, in %) | ||||||
|---|---|---|---|---|---|---|---|
| 2024 | 2025 | 2026 | 2024 | 2025 | 2026 | ||
| BRICS | China | 5.0 | 4.2 | 4.1 | 0.2 | 0.0 | 1.2 |
| Brazil | 3.4 | 1.8 | 2.1 | 4.4 | 5.1 | 4.3 | |
| India* | 6.1 | 6.2 | 6.3 | 4.6 | 3.9 | 4.4 | |
| Russia | n/a | n/a | n/a | n/a | n/a | n/a | |
| South Africa | 0.6 | 1.4 | 1.8 | 4.4 | 3.6 | 4.6 | |
| Asia | Indonesia | 5.0 | 4.7 | 4.7 | 2.3 | 1.7 | 2.5 |
| Malaysia | 5.1 | 4.1 | 3.8 | 1.8 | 2.4 | 2.2 | |
| South Korea | 2.0 | 1.0 | 1.4 | 2.3 | 1.8 | 1.8 | |
| Taiwan | 4.3 | 2.9 | 2.5 | 2.2 | 1.8 | 1.6 | |
| Latin America | Argentina | -1.7 | 5.5 | 4.5 | 219.9 | 35.9 | 14.5 |
| Chile | 2.6 | 2.0 | 2.2 | 3.9 | 4.4 | 3.2 | |
| Mexico | 1.5 | -0.3 | 1.4 | 4.7 | 3.5 | 3.2 | |
| EMEA | Czech Republic | 1.0 | 1.7 | 1.5 | 2.7 | 2.4 | 2.2 |
| Hungary | 0.5 | 1.0 | 3.5 | 3.7 | 4.5 | 4.0 | |
| Poland | 2.9 | 3.4 | 3.5 | 3.6 | 3.9 | 3.0 | |
| Turkey | 3.2 | 2.9 | 3.4 | 58.5 | 33.8 | 22.3 | |
| * Real GDP growth measured over fiscal year from April-March | 13-May-25 | ||||||
| Source: Forecasts for 'BRICS' plus Turkey, Czech Republic, Hungary and Poland are KBC Economics' own forecasts. All others are IMF World Economic Outlook figures. | |||||||
| Policy rates, 10-year government bond yields (in %) and exchange rates (end of period) | ||||||
|---|---|---|---|---|---|---|
| 13/05/2025 | Q2 2025 | Q3 2025 | Q4 2025 | Q1 2026 | ||
| China | policy rate* | 1.40 | 1.40 | 1.30 | 1.20 | 1.10 |
| 10-year yield | 1.66 | 1.51 | 1.51 | 1.56 | 1.56 | |
| CNY per USD | 7.20 | 7.22 | 7.25 | 7.27 | 7.30 | |
| Brazil | policy rate | 14.75 | 14.75 | 15.00 | 15.00 | 15.25 |
| 10-year yield | 13.86 | 13.71 | 13.71 | 13.76 | 13.76 | |
| BRL per USD | 5.67 | 5.60 | 5.53 | 5.46 | 5.46 | |
| India | policy rate | 6.00 | 5.75 | 5.50 | 5.50 | 5.50 |
| 10-year yield | 6.30 | 6.14 | 6.14 | 6.19 | 6.19 | |
| INR per USD | 85.04 | 83.82 | 82.75 | 81.71 | 81.71 | |
| Russia | policy rate | - | - | - | - | - |
| 10-year yield | - | - | - | - | - | |
| RUB per USD | - | - | - | - | - | |
| South Africa | policy rate | 7.50 | 7.50 | 7.50 | 7.25 | 7.00 |
| 10-year yield | 10.49 | 10.34 | 10.34 | 10.39 | 10.39 | |
| ZAR per USD | 18.24 | 17.99 | 17.76 | 17.54 | 17.54 | |
| Turkey | policy rate | 46.00 | 44.00 | 39.50 | 35.00 | 32.00 |
| 10-year yield | 31.90 | 32.00 | 30.00 | 28.00 | 26.00 | |
| TRY per USD | 38.80 | 39.45 | 41.03 | 42.32 | 43.45 | |
| Czech Republic | policy rate | 3.50 | 3.50 | 3.25 | 3.25 | 3.00 |
| 10-year yield | 4.14 | 4.00 | 4.00 | 4.00 | 4.10 | |
| CZK per EUR | 1.47 | 1.40 | 1.40 | 1.40 | 1.45 | |
| Hungary | policy rate* | 6.50 | 6.50 | 6.25 | 6.00 | 5.75 |
| 10-year yield | 7.00 | 6.80 | 6.45 | 6.20 | 6.20 | |
| HUF per EUR | 404.98 | 400.00 | 398.00 | 408.00 | 412.00 | |
| Poland | policy rate | 5.25 | 5.25 | 4.75 | 4.25 | 3.75 |
| 10-year yield | 5.48 | 5.40 | 5.30 | 4.90 | 4.70 | |
| PLN per EUR | 4.25 | 4.25 | 4.20 | 4.20 | 4.20 | |
| *China's policy rate refers to 7 day reverse repo rate, Hungary's policy rate refers to the base rate | ||||||
| There are currently no forecasts provided for Russia | ||||||
Composite Growth Indicators


